

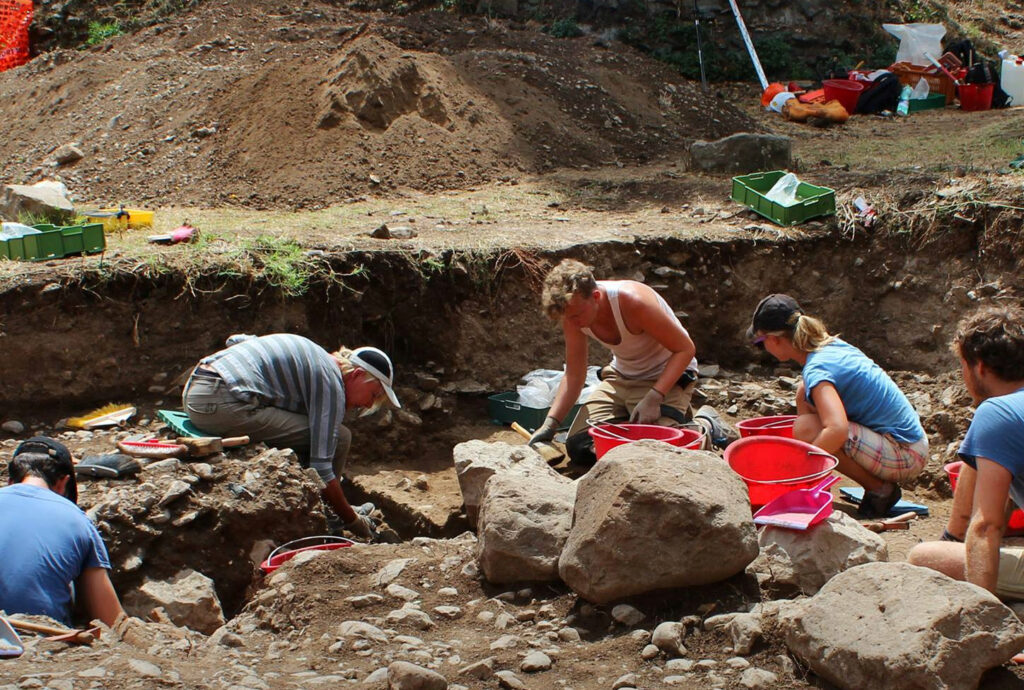
Since 2010, archaeologists from Radboud University Nijmegen have been investigating the area between the fifth and sixth miles of the Via Appia Antica from Rome. During the annual fieldwork, they carry out excavations and accurately measure all archaeological remains. They use not only the spade and the trowel, but also modern laser equipment and digital photography.
To document all research data, the Spatial Information Laboratory (SPINlab) of the Vrije Universiteit Amsterdam, in close collaboration with the Netherlands eScience Center, has developed a data infrastructure with which all data can be stored in a virtual 3D environment and later documented.
Various digital tools have been developed on the data infrastructure with which the area can be visualized and analyzed in a virtual way. This set of tools is used to understand how the road functioned in Roman times, what it looked like and how it has changed over time. This required collecting data from thousands of debris and ruins scattered across the area along the road. Data on the location, size, shape and material, decorations and inscriptions. Also data from excavations of remains of monuments. All this data was collected and made available in a virtual 3D model.
The help of Fugro GeoServices has been called in for the three-dimensional measurement. With the DRIVE-MAP system, the research area was scanned from the road with extreme accuracy.
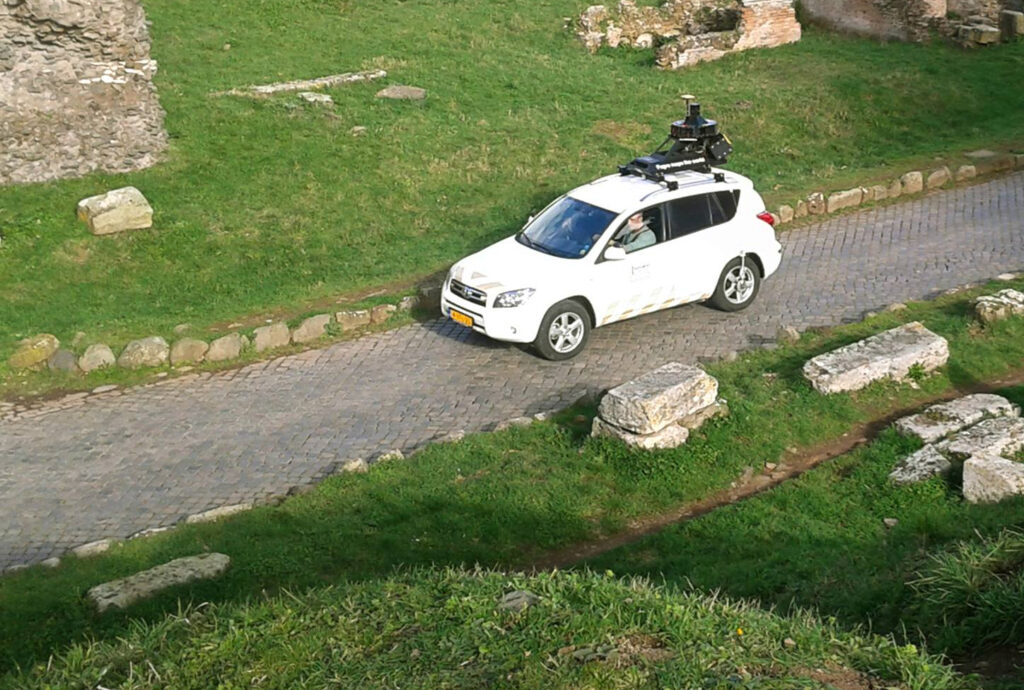
The system uses a panorama camera, high-resolution still cameras and laser scanners at the same time. With a GNNS receiver, the resulting 3D point cloud can be directly related to the exact position on the earth’s surface. The DRIVE-MAP dataset was then supplemented with 3D models generated by the range image technique photogrammetry. Simply put, this technique generates 3D objects based on overlapping patterns in photos.

Rens de Hond at Universiteit van Nederland
The SPINlab and the Netherlands eScience Center have joined forces to create an information system based on this data that can be used by archaeologists as an analysis tool. Together they have set up a data infrastructure that can be used on all kinds of platforms.

Maurice de Kleijn at Scientific Visualization
The 3D model of the Via Appia is beautifully combined with the art project of Krien Clevis in the exhibition REVISTED, in which the Via Appia is shown by image makers, their images and points of view.
Also read the scientific articles
about the project:

de Kleijn, M., de Hond, R. J. F., & Martinez-Rubi, O. (2016). A 3D GIS Infrastructure for “Mapping the Via Appia”. Digital Applications in Archaeology and Cultural Heritage, 3(2) [download]

Oscar Martinez-Rubi, Maurice de Kleijn, Stefan Verhoeven, Niels Drost, Jisk Attema, Maarten van Meersbergen, Rob van Nieuwpoort, Rens de Hond, Eduardo Dias & Pjotr Svetachov (2016) Using modular 3D digital earth applications based on point clouds for the study of complex sites, International Journal of Digital Earth, 9:12, 1135-1152 [download]
Explore all the monuments in 3D on SketchFab >>>